![Why Infographics Are Still Essential for Your SEO Strategy [Updated 2026]](https://digilite.ca/wp-content/uploads/2024/02/Why-Infographics-Are-Still-Essential-for-Your-SEO-Strategy-in-2026-1920x1080.jpg)
The internet is flooded with content, but publishing more isn’t enough to capture attention anymore. With search behaviour evolving through AI and visual tools, users demand faster answers and clearer experiences.
To win today, your content must be engaging, optimized for search engines, and reference-worthy.
That is where strategic visual content comes in. Research-driven infographics do more than just decorate a blog post; they simplify complex ideas, earn valuable backlinks, and boost your brand’s authority across search engines and social platforms.
In this guide, we explore why infographics are essential for modern SEO and how to create visuals that drive real marketing results.
What Counts as an Infographic, Exactly?
An infographic visually represents information to make complex ideas easier to understand.
Instead of presenting information through large blocks of text, infographics combine:
- Data
- Illustrations
- Charts
- Icons
- Short explanations
- Visual storytelling
The goal is simple:
Help people understand important information faster.
For example:
A financial company could create an infographic explaining:
- Mortgage approval steps
- Interest rate changes
- Home-buying costs
A software company could create:
- An automation workflow diagram
- A comparison between manual and automated processes
- Industry adoption statistics
A healthcare organization could create:
- A prevention checklist
- Treatment timelines
- Health awareness statistics
The best infographics answer a specific question or solve a specific problem.
The Different Types of SEO Infographics Businesses Can Use to Support Their Marketing Goals
Not every infographic serves the same purpose.
A common mistake businesses make is creating visual content simply because it looks engaging. However, the most effective infographics are created with a specific marketing goal in mind.
Are you trying to attract backlinks? Educate potential customers? Explain a complicated service? Support a sales conversation?
The answer determines what type of infographic will create the most value.
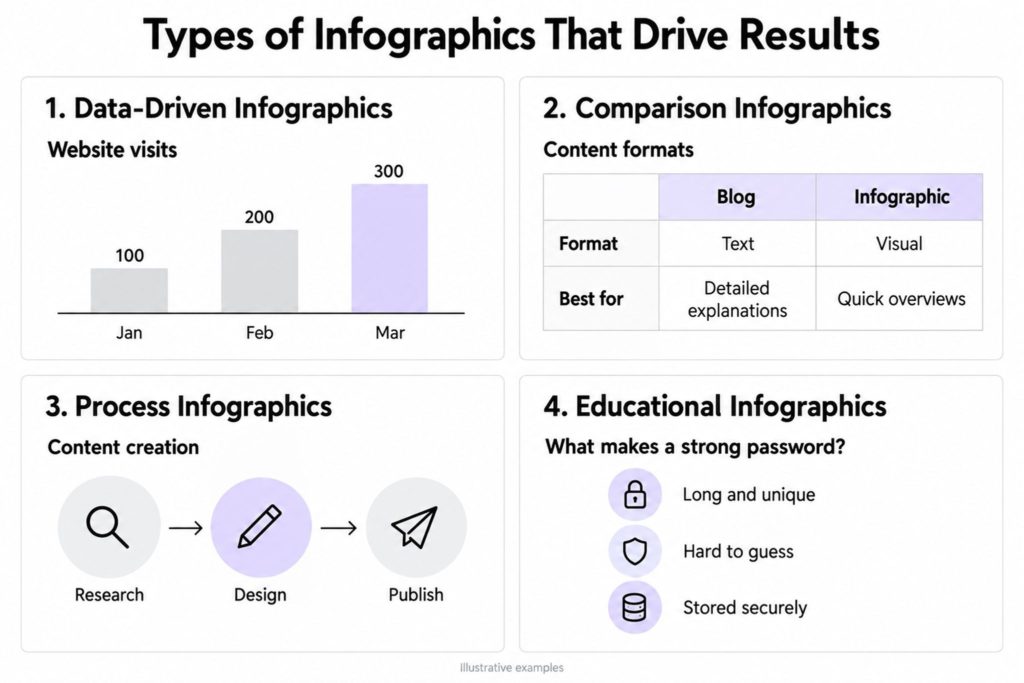
1. Data-Driven Infographics: Turn Research Into Shareable Industry Insights
Data-driven infographics transform statistics, research, and industry findings into a visual story.
Instead of asking users to interpret a report filled with numbers, businesses can highlight the most important insights through charts, graphs, and visual comparisons.
For example, a digital marketing agency could publish:
“2026 Digital Marketing Trends Every Business Owner Should Know”
The infographic could showcase:
- Changes in consumer search behaviour
- AI adoption trends
- Marketing channel performance
- Customer expectations
This type of content works especially well for SEO because original research creates something other websites may want to reference.
A business publishing unique insights is more likely to earn mentions, citations, and backlinks compared with another generic article repeating information already available online.
2. Comparison Infographics: Help Customers Make Better Decisions
Many customers search online because they are comparing options.
They want to understand:
- Which solution fits their needs?
- What are the differences?
- What are the advantages and limitations?
Comparison infographics simplify these decisions.
For example:
A software company could create:
“Manual Processes vs. AI-Powered Automation: What Businesses Need to Know”
A web development company could create:
“Custom Website vs. Website Template: Which Option Is Right for Your Business?”
A comparison infographic helps users quickly understand differences without reading multiple pages.
This type of content is also valuable for businesses because it supports customers further down the buying journey. Someone comparing solutions is often closer to deciding than someone simply searching for general information.
3. Process Infographics: Make Complex Services Easier to Understand
Many businesses offer services that are difficult to explain.
Customers may not understand:
- How the process works
- What happens after contacting you
- Why your approach is different
- What results they can expect
Process infographics solve this problem by visually explaining the journey.
For example:
A digital agency could create:
“Our Website Development Process From Strategy to Launch”
Showing:
- Discovery and planning
- Design and user experience
- Development
- Testing
- Launch and optimization
This type of infographic builds trust because customers know what to expect before they start working with you.
4. Educational Infographics for SEO: Build Trust Through Knowledge Sharing
Educational infographics are designed to explain complicated topics simply.
They work especially well for industries where customers need education before they are ready to buy.
Examples:
A financial company could explain:
“How Interest Rates Affect Your Mortgage Payments”
A technology company could explain:
“How AI Agents Automate Business Workflows”
A healthcare provider could explain:
“Signs You Should Schedule a Preventive Appointment”
By helping customers understand a topic, businesses demonstrate expertise before the sales conversation begins.
This supports stronger brand authority and helps businesses become trusted sources of information.
Why Infographics Matter for Modern SEO (And How to Leverage Them)
Search engines are constantly evolving to prioritize helpful, original content that truly demonstrates experience and expertise. If your strategy relies solely on standard text blocks, you might be missing out on a powerful tool: infographics.
Here is a breakdown of why your business needs infographics and how to use them effectively.
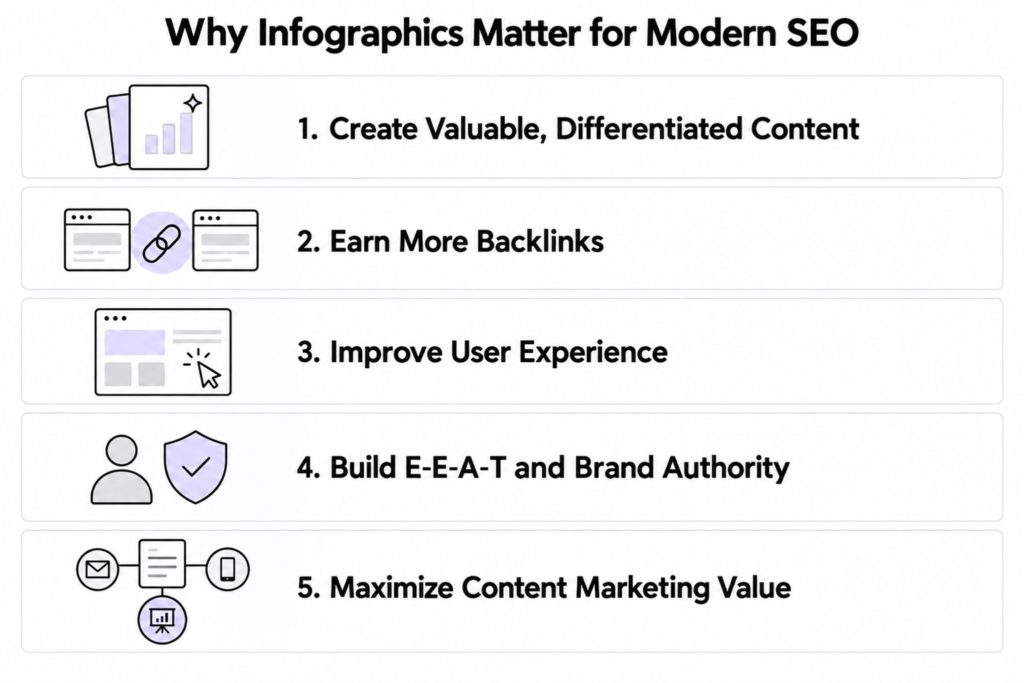
1. Create Valuable, Differentiated Content
Search engines favour content that provides real value. Infographics transform complex information, data, and insights into unique, easy-to-understand resources that better match search intent and support GEO strategies.
2. Earn More Backlinks
High-quality infographics are highly shareable and often referenced by other websites, helping you earn valuable backlinks, referral traffic, and stronger authority signals.
3. Improve User Experience
People often scan content before reading it. Infographics simplify complex topics, highlight important information, and make pages easier to understand, improving engagement and reducing bounce rates.
4. Build E-E-A-T and Brand Authority
Original research, data-driven visuals, and educational resources help demonstrate expertise and build trust with both users and search engines.
5. Maximize Content Marketing Value
A single infographic can be repurposed across multiple channels, including:
- Blog content
- Social media posts
- Email campaigns
- Sales presentations
This helps extend the reach and impact of your content investment.
Best Practices for Creating SEO-Friendly Infographics
Creating a great infographic requires more than just graphic design skills. Keep these steps in mind to maximize your search impact:
- Start With Search Intent: Target real customer questions, trending topics, and content gaps.
- Use Reliable Data: Build trust by sourcing information from government reports, industry studies, or first-party data, and credit your sources.
- Optimize for Search Engines:
- File Name: Use descriptive names like seo-infographic-content-strategy.png instead of generic strings.
- Alt Text: Write clear, keyword-rich descriptions for accessibility and image search.
- Context: Always surround your infographic with a thorough, relevant article.
- Design for Mobile: Ensure text is readable, layouts are responsive, and the file loads quickly for smartphone users.
- Proactively Promote: Great design needs distribution. Share your visual assets via social channels, digital PR, industry communities, and email campaigns.
Common Pitfalls to Avoid
- Designing Without a Strategy: Ensure every visual ties back to a core business goal, whether that is brand awareness, lead gen, or link building.
- Using Outdated Statistics: Stale data quickly destroys credibility. Always verify publication dates.
- Cluttering the Design: Less is more. An infographic should simplify a topic, not try to cram an entire textbook into one image.
- Neglecting Distribution: Publishing and walking away guarantees low visibility. Always put effort behind promotion.
Looking to combine SEO services, content strategy, and standout design to build stronger digital experiences? Reach out to us at Digilite to elevate your brand’s digital presence.
Frequently Asked Questions (FAQs)
1. Do infographics help with SEO?
Yes. While infographics do not directly improve rankings, they can support SEO by improving user experience, attracting backlinks, and helping businesses create valuable content.
2. Why are infographics important for content marketing?
Infographics make complex information easier to understand and share. They can also be reused across blogs, social media, email campaigns, and sales materials.
3. Are infographics still effective for SEO in 2026?
Yes. Original, data-driven infographics can help businesses stand out in search results, build authority, and support AI-driven search strategies.
4. What makes an infographic SEO-friendly?
A successful infographic should include valuable information, accurate data, optimized file names, descriptive alt text, and supporting written content.
5. What types of infographics work best for businesses?
Common formats include data-driven infographics, comparison visuals, process explanations, and educational guides.
6. Can infographics help generate leads?
Yes. By simplifying complex topics and building trust, infographics can help visitors better understand your services and move closer to making a decision.
7. How can businesses use infographics beyond SEO?
Infographics can be repurposed for social media, email marketing, presentations, and other digital marketing campaigns.
![SEO in 2026: Preparing for AI-Driven Search and Zero-Click Results [Updated]](https://digilite.ca/wp-content/uploads/2025/04/AI-Driven-Search-and-Zero-Click-Results.jpg)