Canadian State of UX Report in 2018, ahead of an all out effort to create a comprehensive report for of the 10th edition of CanUX in 2019. This year’s report also creates a baseline that will allow us to follow the evolution of our community of practice year over year.
Here is the sum up of the report:
#1 Demographics
A total of 447 UX professionals from 11 of Canada’s 13 provinces provided the baseline data for this year’s report. Of those 447 responses, 381 (85.2%) originated from Canada’s most populated provinces, Ontario and Quebec, home to 22.6 million of Canada’s 36.6 million people according to StatsCan’s 2017 Census.

Number and Percentage of Responses by Province
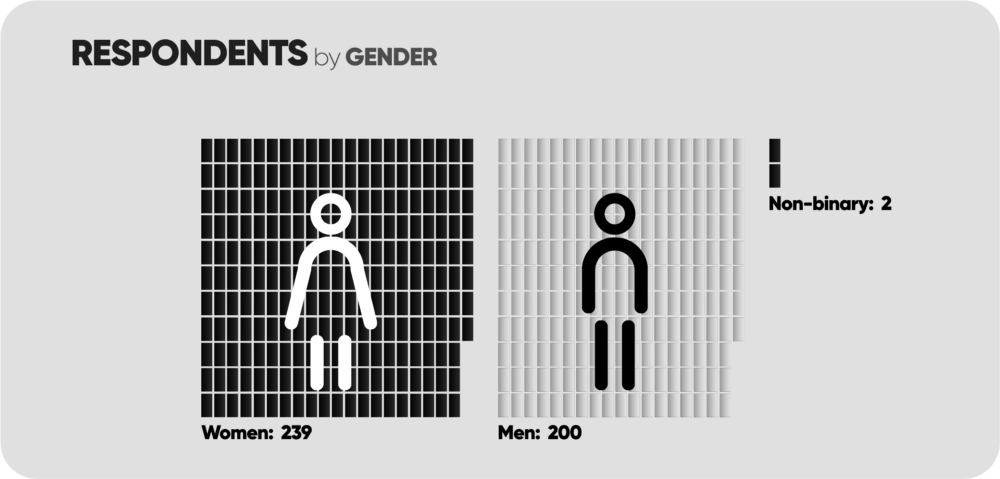
Of the respondents who identified their gender, women accounted for 239 (53.0%)responses, followed by men with 200 (44.7%) responses, and non-binary individuals with 2 (0.44%) responses.

Responses by gender
The majority of our respondents were aged 26 to 35 (36.4%) and 36 to 45 (33.1%), accounting for almost 70% of the total responses. This bodes well for our community going forward, as the numbers are balanced very well (47.6% to 51.9%) between respondents aged 18 to 35 and respondents aged 36 to 55+.

Responses by age range
From an education perspective, Bachelor’s Degrees are the most prevalent amounting to 191 (42.7%) responses, following by Master’s Degrees with 130 (29.1%) responses, and College Diplomas with 77 (17.2%) responses.

Responses by Education // grouped by gender
#2 Maturity
Approximately 40% of responders self identify as ‘UX Designers’, while ‘UX Generalist’, ‘UX researcher’, ‘UX Lead’ and ‘Interaction Designer’ each hover around 25%. ‘UX Strategist’, ‘Information architect’ and ‘Visual Designer’ appear in 15–20% of responses, while all UX leadership positions and ‘Content Strategist’ are the least popular titles.
While the chart doesn’t include a gender breakdown, only 5 of the 41 respondents (12.1%) who described their titles as ‘Head of UX’, ‘VP of UX’, or ‘CXO’ self identified as visible minorities, and only 13 of 41 (31.7%) self identified as women, meaning that in terms of diversity in leadership positions we still have a long way to go.

Responses and Percentage of Responses by UX Job Titles
193 (43%) of respondents are employed by a large corporation with 500 or more employees, followed by a medium to large corporations with 100 to 500 employees (16.7%) and small companies with less than 10 employees (15%). Companies with 10 to 100 employees accounted for about 25% of the total responses, and are the least represented segments in our report.

Responses and Percentage of Responses by Company Size
#3 Tools
From an interaction design and prototyping tools perspective, the Adobe Creative Suite (62.8%) is leading the way on the strength of its graphics editing programs (Photoshop and Illustrator). It’s not surprising to find Sketch and InVision following closely behind at 49.2% each. The only other tools currently holding a solid foothold in the market included HTML/CSS (41.6%), Axure RP (32.7%) and Balsamiq (24.6%).

Responses and Percentage of Responses by Interaction Design & Prototyping Tools
The distribution of the top UX research tools is much significantly skewed towards the top 2. The Optimal Workshop Suite (35.3%) and UserTesting (28.4%) appear to be the only research tools with a significant user base in the Canadian market. Hotjar (11.6%) and Morae (10.1%) are the only other tools reaching double digits percentage wise.

Responses and Percentage of Responses by Research Tools
#4 Salaries
Finding reliable salary data relevant to Canadian UX professionals is quite difficult, and the numbers vary significantly from source to source. The average Canadian UX professional salary (Cdn$81,962) is Cdn$37,272 or 31.2% less than the average advertised salary for American UX professionals. These figures were calculated based on the exchange date on Nov 1st, 2018.

Salary comparison between Canada and the US // Indeed.com data as of Nov 1st, 2018.
The average salary for women UX professionals in Canada is $78,095, while the average male salary is $86,364. This means women in Canada make an average of $8,269 or 9.57% less than the men.

Average salaries for women and men in Canada
If we slice the salary and gender data by experience, the numbers paint an interesting picture. Earlier (< 3 years of experience) and later in our careers (>8 years of experience), men tend to have significantly higher salaries than women. In a specific half decade mid-career (3–8 years of experience), women reverse the trend and make slightly more than men.

Salary by Experience // grouped by gender
When slicing the data by company type, those self-identifying as white (the dark bars) report significantly higher salaries than visible minorities (the light bars). The largest discrepancy in salaries occurs in the NGO/Non-profit and Academia/Education sectors, where visible minorities are shown to make significantly less.

Average Salary by Company Type // grouped by ethnicity


